
Chartify – WordPress Chart Plugin v3.8.1
Chartify is a powerful WordPress Chart Builder Plugin that will help you to create WordPress Graphs & Charts easily and quickly.
Tags / visualization
33 WordPress plugins tagged “visualization”. Every result links to a crawlable PlugIndex profile.
Chartify is a powerful WordPress Chart Builder Plugin that will help you to create WordPress Graphs & Charts easily and quickly.

Customizable HTML5 Audio controller with waveform preview (mixed or split channels), using WordPress native audio and playlist shortcode.

Visualize your site's internal link structure in one click and find pages with no inbound or outbound links.

Easily integrate Three.js with WordPress to create and display 3D models and animations.

Visualize your site's internal and external links as an interactive map. Discover orphan content and optimize your linking strategy.

Transform any text outline into a visual, interactive mind map to simplify complex ideas, like a game — no coding required.

Integrates the SIMILE Timeline into WordPress and provides an option interface for the various timeline settings.

Add the entire Cloudstitch library of spreadsheet-powered visualizations and widgets with just a shortcode.

Add a nice graph with your published posts during the last 30 days on a dashboard widget.

Visual Editor for 33+ free responsive SVG data charts - as easy as adding an image. No technical skills needed. Live data. No external API calls.

DataPress lets you publish rich, interactive data visualizations in your blog pages and posts.

DHPress is a flexible, repurposable, fully extensible digital public humanities toolkit designed for non-technical users.

Import your data from csv files and visualise them on Google streets/satellite maps
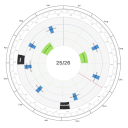
A circular year planner to visualize fiscal years and events.

Make your recipe blog look awesome with pretty and insightful visualizations.

Add Google charts and graphs to your WordPress site based on tallies of any numeric custom field over time. Visualize progress toward any goal.

An easy to use yet powerful visualization tool for WordPress

Online selling like in-store selling with full 3D visual product configurator

Visualize your internal link structure as an interactive map in the WordPress admin. Find orphaned posts and improve your site's SEO.

Adds a symmetrical graph of YARPP-related articles below singular posts.

The lightest way to create beautiful, responsive charts in WordPress. No database clutter, no heavy libraries — just pure performance.

Plug-in per la visualizzazione dei dati COVID-19 della regione Toscana.

Display privacy-friendly country visit statistics on an interactive, customizable globe.

A plugin to embed graphical recipes from http://www.gracipe.com into Wordpress.